Table Of Contents:
Executive Summary
The Core Objectives: Stability, Yield, and Shape
The Integrated Workflow: From Lab to Simulation
How to Identifying the Optimal Window
Conclusion
Executive Summary
The morphology of an Active Pharmaceutical Ingredient (API) - its size and shape - is a critical quality attribute (CQA). Crystal habit directly influences the efficiency of downstream isolation steps, such as filtration and drying, as well as the drug product’s final stability and performance [1].
Achieving control of the morphology of an API through traditional, empirical experimentation is difficult. The interactions between supersaturation, heat transfer, and face-specific (anisotropic) growth kinetics are complex and non-linear. Consequently, an experimental approach alone often fails to identify the narrow operating windows required for optimal crystal habit, leading to iterative testing cycles, excessive API consumption, and extended development timelines.
This article outlines a mechanistic modeling workflow designed to accelerate development, reduce API consumption, and ensure a seamless crystallization tech transfer from lab to commercial scale.
The Core Objectives: Stability, Yield, and Shape
A robust crystallization process must satisfy three primary criteria to be commercially ready:
Objective | Target Metric | Impact |
|---|---|---|
Process Stability | Maintain Supersaturation (S) between 1.0 < S < 1.5 | Prevents uncontrolled nucleation and the formation of amorphous material or inconsistent polymorphs [2]. |
Operational Yield | Maximize conversion of dissolved solute to solid | Directly impacts cost of goods sold and process efficiency; minimizes API loss. |
Morphological Control | Aspect Ratio (Y/X) = ~1.0 | Produces equant crystals, which flow better than needles and are less prone to breakage during filtration and drying. |
The Integrated Workflow: From Lab to Simulation
The workflow moves through four distinct phases, replacing physical experiments with a few targeted calibration runs.
Phase 1: Material and Equipment Definition
Before modeling begins, the environment is defined.
Material System: Densities, molar masses, viscosities, and specific heat capacities for the API, solvents, and antisolvents.
Equipment System: Tank diameter, impeller type, and jacket volume. This ensures the model accounts for the physics of the specific vessel used.
Phase 2: Targeted Calibration Experiments
Two specific lab-scale experiments are required to seed the model with real-world data:
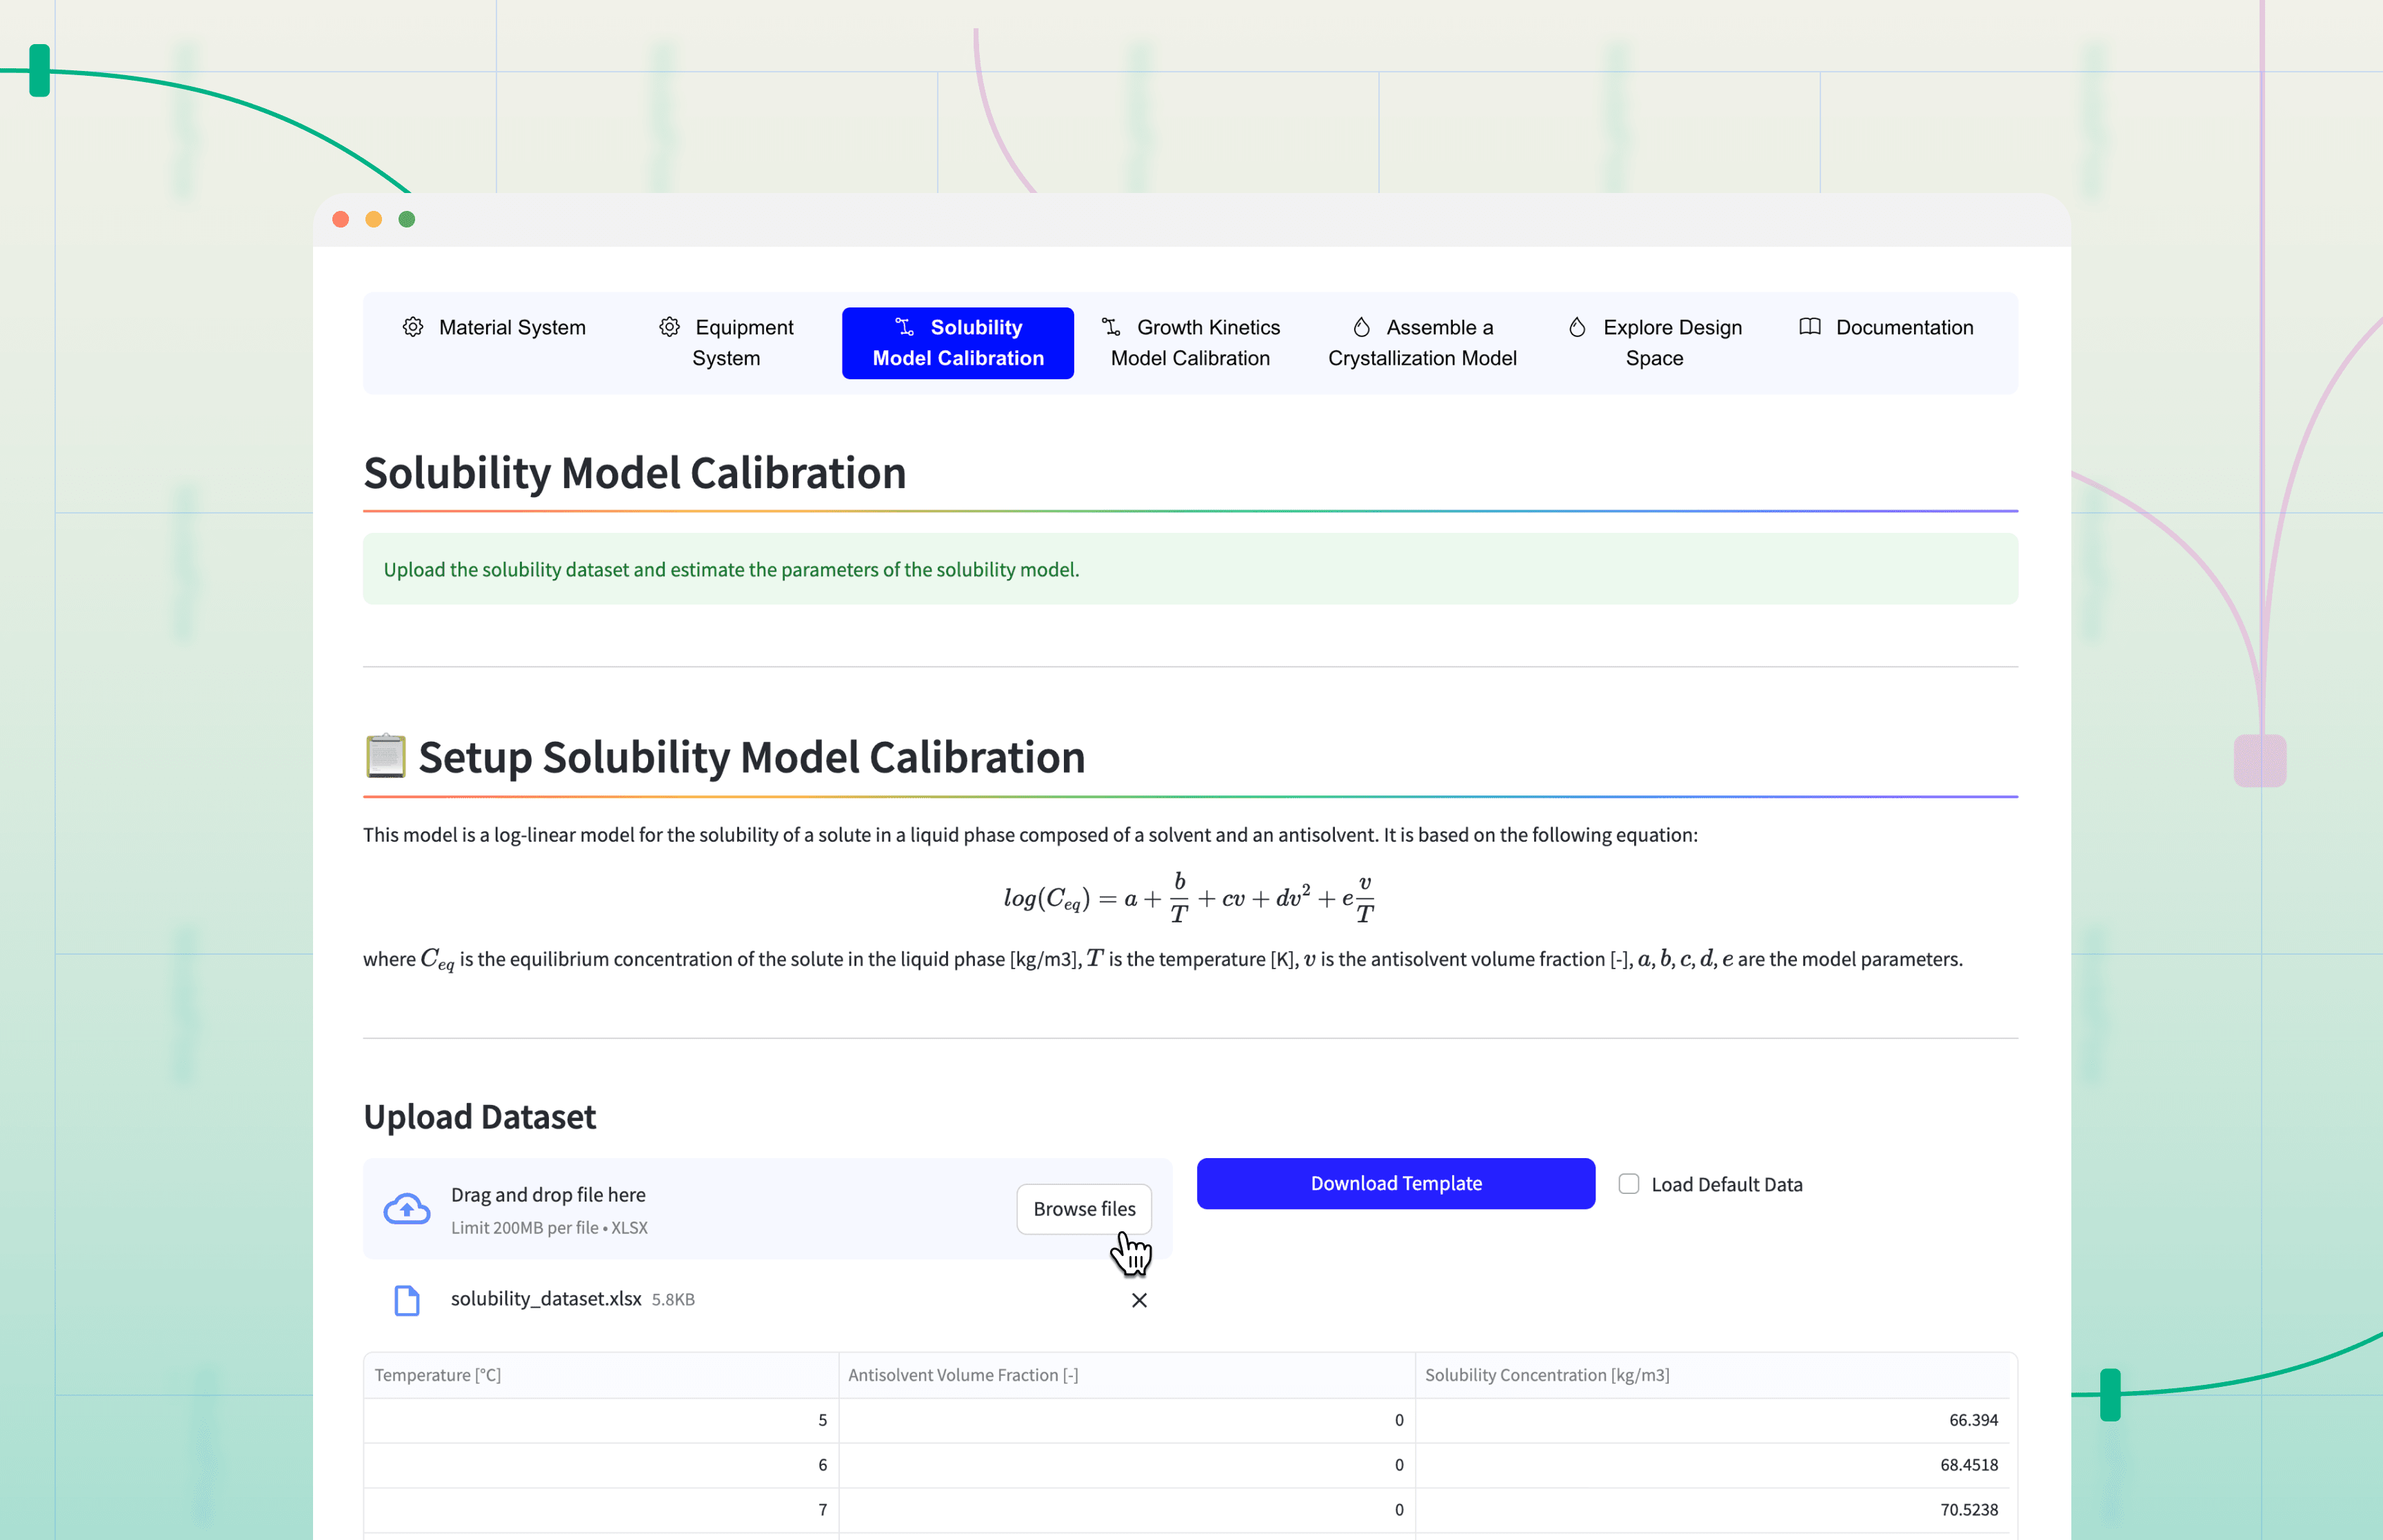
Solubility Experiment: Measuring saturation temperatures across various solvent/antisolvent ratios to map the thermodynamic boundaries.
Growth Cell Experiment: Using high-resolution microscopy to observe a single crystal's growth along its axes. This captures the intrinsic anisotropic growth kinetics - how fast the crystal naturally grows in different directions.
Phase 3: Ready to Go Scale-Up
The model integrates the experimental data with mass and energy balance equations making predicting what will happen as the process is scaled easy:
The Scale-Up Bridge: It decouples the shape of the crystal (measured in the lab) from the speed of growth governed by the reactor's mass balance. This allows the simulation to predict the outcome in, for example, a turbulent 500L tank using data gathered from a microscope slide.
Phase 4: Design Space Exploration
The final stage is the virtual design space. Scientists can run parameter sweeps on:
Seeding Strategy: Seed loading, initial seed size, and supersaturation at the moment of seeding.
Process Dynamics: Cooling duration, antisolvent addition start times, and impeller speeds.
How to Identifying the Optimal Window
The simulation generates dynamic plots that serve as a "flight simulator" for the crystallization process.
Decision Logic and Results Interpretation
The Supersaturation Profile: If the Supersaturation curve exceeds 1.5, the process is at risk of .
Remedy: Increase cooling duration or slow down antisolvent addition.
Aspect Ratio Evolution: If the Y/X ratio stays high (e.g., > 3), the crystals are becoming needle-like.
Remedy: Adjust the initial seeding temperature or change the solvent composition to favor equant growth.
Yield Verification: Ensure the concentration curve flattens at the end of the batch, indicating maximum recovery of the API.
Conclusion
For pharmaceutical manufacturers, adoption of mechanistic crystallization modeling is a strategic shift from "trial-and-error" experimentation to proactive, predictive process development. By grounding development in fundamental physics, we can build deeper process understanding - balancing the critical drivers of metastable zone stability, maximum yield, and equant morphology.
Ultimately, leveraging these models allows teams to significantly reduce costly physical experimentation while de-risking technology transfer and scale-up. The result is a more robust process, a consistent physical product, and a faster path to market for high-quality medicines.
At Polymodels Hub, it’s our mission to help pharma companies harness the power of data and models in apps and workflows to accelerate drug development.
What if you could plug and play a workflow like this one? The Morphological Crystallization workflow for scale-up is one of many workflows available in ModelFlow.
Book a demo to see how reusable workflows can accelerate your R&D pipelines.
References
Yuan Gao, Wenxi Song, Jinyue Yang, Xiongtao Ji, Na Wang, Xin Huang, Ting Wang, and Hongxun Hao. Crystal Morphology Prediction Models and Regulating Methods. Crystals, 14(6):484, June 2024. doi:10.3390/cryst14060484.
Venkateswarlu Bhamidi, Paul J. A. Kenis, and Charles F. Zukoski. Probability of Nucleation in a Metastable Zone: Induction Supersaturation and Implications. Crystal Growth & Design, 17(3):1132–1145, March 2017. doi:10.1021/acs.cgd.6b01529.
